A/B Testing a Website to Improve Conversion Rates
Blogs
Every website can be improved in some way to provide a better user experience and increase conversion rates, but to do that effectively you have to test what works best. That’s the only way to know how users behave on a website and which pages or page sections they prefer.
Testing is a crucial step when implementing website changes and the simplest form of testing is A/B testing – simply running a live trial between 2 different options. However, it’s important that tests run for long enough to reach a meaningful number of web visitors with the right buying intent.
The tests need to be devised in such a way that the conversion actions generated are high-quality and result in commercially-driven leads. For example, there is a big difference between a conversion rate for people downloading, for instance, a “How-To” guide that might enable them to do something themselves and a conversion rate where people contact a business or buy a product.
A/B testing needs to use a structured approach that will generate meaningful results for a business so let’s look at the basics of how to create an effective A/B test.
Getting started with an A/B test
The first step is to identify a page on a website that could be improved to achieve a specific goal. The page should already be generating visits so that the test has enough data with which to draw a conclusion. For websites with few visitors this might mean running the test for a month or more, but for others a few days might suffice.
Then, create a second variation of the existing page so you have an “A” version and a “B” version with a simple difference between the two. This difference can be a different colour or position for a call-to-action button, or it could be a new image, or different wording. Keep the difference simple to start with so that each test and subsequent test are only comparing one change.
Then show each of the two variations to 50% of site visitors simultaneously – this ensures the test is not impacted by the time of day or the day of the week. Half the visitors will see variation “A” and half will see variation “B”.
Testing further variants
Once you have enough data to make a choice between which A/B variant produces the highest conversion rate then you can take that test and create another variant to test against it. Then repeat the process for as long as it takes to determine the best variant of the page.
It’s perfectly possible to continuously run simple A/B tests in this way, comparing two variants against each other at a time. However, that process can be refined by using split testing, which is similar to A/B testing but uses more than two variants allowing multiple ideas to be tested at the same time.
For example, when the self-storage company Storing.com created a new table comparing storage prices their aim was to increase the number of people requesting a quote for their self-storage services so the new page contained a “Get a Quote” button as a call-to-action (CTA). They started by testing variations of the CTA button in multiple combinations of their three brand colours: dark blue (hex code #02224e), mid-blue (hex code #2974ac) and orange (hex code #f28500). What they actually found was that a different colour altogether had by far the highest click rate (green #149414) because it stood out from the page amongst their other brand-coloured items as you can see in the image below.

Each test used the same wording, formatting and styling and they changed nothing else on the page except the colours to ensure it was a genuine split test. And because their website has a large enough audience, they could speed up the testing process and try out a wide range of complementary colours – hence the discovery of the high-converting green.
The impact of implementing the green “Get a Quote” button was to increase conversion rates by 28.4% over the original orange button on a mid-blue background.
Note that if Storing.com had also used different wording as well as the different colours in this test that would have technically been a multivariate test, which is more complex to set up and run. So, they kept it simple by sticking to A/B and split testing.
What else to test
A/B testing or split testing doesn’t have to be restricted to clicking buttons or other elements on a web page. It can also, for example, be used to test the impact of different wording, fonts and layouts on Engagement Rate i.e. how long people stay on the page and read the content. This can contribute to increasing brand awareness for business that provide expert information and want to build up their online authority.
Simply increasing Engagement Rate (which is a standard metric in Google Analytics 4) will also have a positive impact on search ranking positions so testing a range of changes to a page is definitely worthwhile. And, remember, what works in one industry may not work in another, and what works for one website may not work for another. The popular green with hex code #149414 that worked in the example above would be unlikely to work for a website which already had green as a brand colour (although worth testing). Always perform your own testing focused on your target audience – it’s simple to set up and some tools are even free for basic testing. Whatever tool you decide to use the basic steps of an A/B testing process are the same…
5 steps to developing, measuring and implementing an A/B test
1. Establish specific goals
You can only know whether you have achieved a goal by clearly and specifically setting out what the goal is. Goals should be, for instance, “increase Engagement Rate on the home page” (note again that “Engagement Rate” is a standard Google Analytics 4 metric) or “increase clicks on home page CTA”. If you find yourself setting vague goals such as “improve effectiveness of home page” or “convert more visitors” then it will be difficult to decide which tests to carry out and measure if they have been successful.
Clearly, a B2B company will be more likely to have testing goals focused on improving engagement whereas a B2C company would be more focused on increasing product purchases. If in doubt, clarify the business objectives first and then consider how the website can help achieve these objectives. Once you know that, you can prioritise key performance indicators (KPIs) which will give you the target metrics to use for the tests to be performed.
It can be difficult to determine what is a good conversion rate for any given business so the best starting point is often to simply to increase your current conversion rate from the current level.
If the KPIs to be tested are not already set up as Conversion Events in Google Analytics 4 (previously known as Goals in Google’s Universal Analytics) see this Google Analytics 4 (GA4) guide about setting up conversion events.
Standard Google Analytics 4 reports, like the one below from Ditto Digital, are available to show conversions from different events such as completing a contact form on a website:
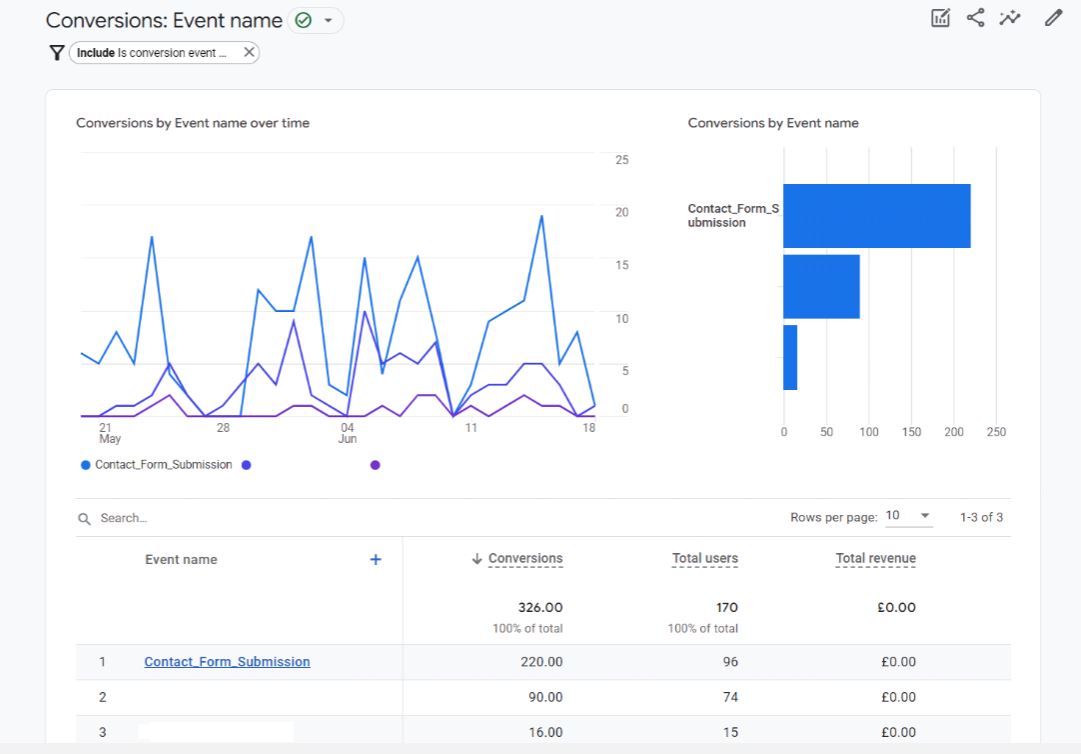
You can also access these data in more detail in GA4 for a better understanding of different types of conversions. In the example from Ditto Digital above, Contact Form Submission goals make up 67% of the website’s total conversions and the other two goals make up 28% and 5% of the total conversions respectively. A reasonable goal for an A/B test might be to increase the 5% conversion rate to 10%. As a service-based B2B company this level of improvement could be significant.
2. Select a page to test
Now you know the goal you’ll need to select the page to be tested that can help achieve that goal. That page might seem obvious – for instance, if the goal is to increase the number of people who submit a contact form then that form probably exists already on a “Contact Us” page.
However, before deciding on the page, take a look at the highest traffic pages in Google Analytics. It could well be that the Contact Us page gets very little traffic but a contact form could be embedded on some of the higher traffic pages. Before you even start the A/B test this could give you a better chance of success as more people will see the contact form.
It would also be worth looking at current engagement and conversions in Google Analytics for the high-traffic pages. If they already perform well there may be less room for improvement.
As you can see selecting which page to test is an important decision – don’t rush it but analyse all the data to hand first to help make a better-informed decision.
3. Select elements to test
Now you know what your goal is with A/B Testing and which page you will use to achieve that goal. The next step is to decide which element on the page to test or whether to create an entirely new element.
Here are some web page elements that could form part of an A/B test:
- Call-to-action (CTA) text
- CTA appearance – colours, fonts, layout, button style
- CTA location on the page: above the fold, left, right, repeated, in the menu bar
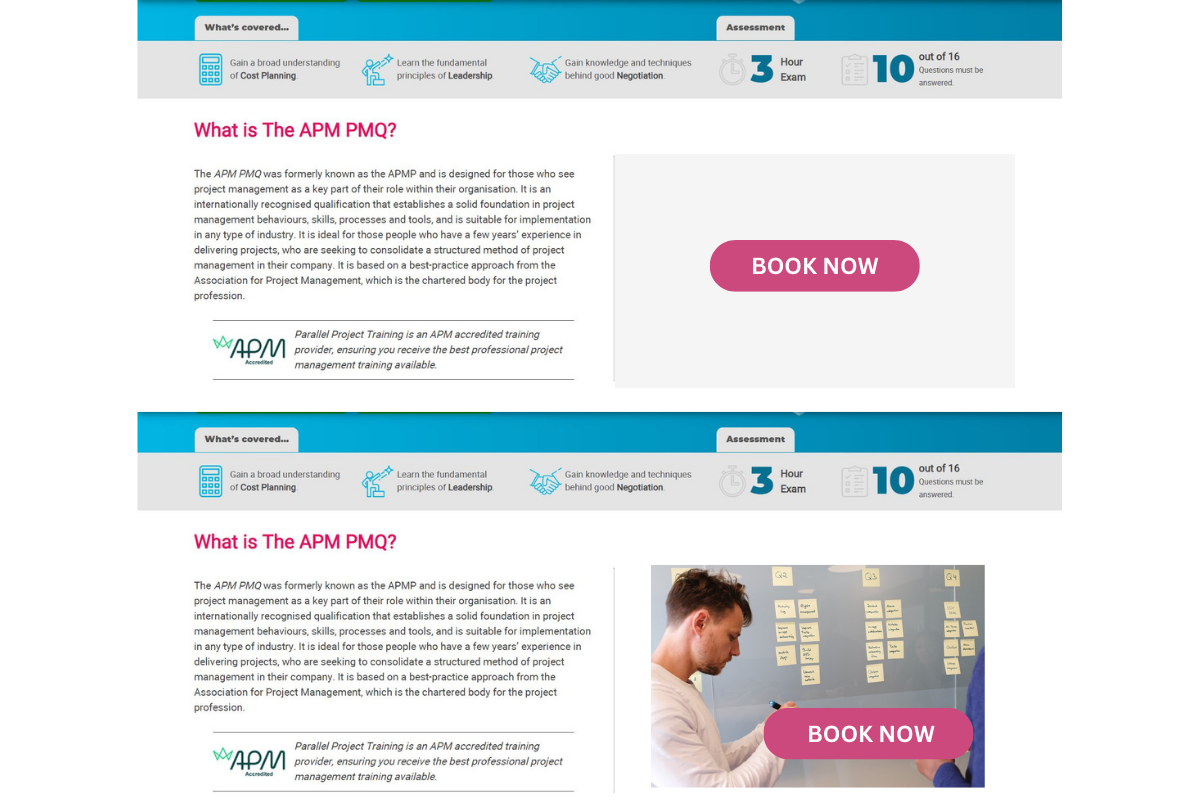
Always consider new graphics and colours, especially colours that stand out from the main brand colours. Also consider real-life images overlaid with CTA text and a button. This was one of the tests used by Parallel Project Training to determine whether visitors were more likely to click a standard button or a button overlaid on a real-life image. They ran a series of tests for four months and found that using a CTA button on a real-life image improved the conversion rate by 38.15%.
There is plenty of evidence to show that the colour of website design elements trigger emotional changes
in visitors that can increase conversions, but don’t neglect the impact of real life images to trigger emotions too – as the above example showed.
Of course, a single image, button colour or button position is just one element in a whole website and the user’s journey through, and experience with, the website will also contribute to their decision-making process, consciously or sub-consciously. Improving just a single page on a website that otherwise does not provide a good user experience will be limited in how much of an improvement can be made.
4. Running the test
The hard work is done now and all that’s required is to start running the test and fine-tuning it. Tools such as HotJar, CrazyEgg or Optimizely (and plenty of others) can help here, with easy-to-use visual editors and simple setup procedures. Google Analytics 4 also has A/B testing features which are free to use.
For WordPress websites, HotJar, CrazyEgg and Optimizely
are all well integrated with WordPress via plugins.
Once you’ve started your test, let it run until it has collected a statistically significant amount of data. As a broad rule, you want data collected for visitor numbers in at least 3 figures, preferably 4 figures, to be sure the data doesn’t lead to any inaccurate conclusions because of too little data. Don’t make any decisions based on the first few results. Also let the test run for full days, weeks or months to eliminate variations over time periods; and don’t let the test run between periods when you would normally expect to see seasonal variations in conversion rates anyway.
A/B testing can often lead to a clear “winner” but not always, and sometimes there is little difference between two or more variations. If this is the case, reconsider what elements you are testing and expand the variations. For instance, if you have only tested different colours, try different fonts, wording, CTA positions etc.
5. Implementing data-driven changes
The cumulative results of each A/B or split test will help you make data-driven changes to a page so it is well-optimised for conversions. Once the test page has been changed so that it is based on the variation that delivered the highest conversion rate you can consider testing further elements on the page, or setting new goals and testing new pages.
Conversion rate optimisation is not necessarily an ongoing process and depends on the business and its goals, but it should be reviewed periodically, especially when new products or services are added to a website or conversion rates drop on existing pages.
Conclusion
A/B tests are a valuable technique to help businesses understand more about web visitors’ behaviour on a page; and use that knowledge to change pages to more effectively convert those visitors according to business goals.
Every website has room for improvement and A/B testing will provide the insights needed to make those improvements, which is why it is a worthwhile exercise for every website.